VisualPoint Tutorials
From OO Lab
Revision as of 16:06, 13 July 2014 by Rickychien (Talk | contribs)
Contents |
Download Example
Download example here File:VisualPoint Example.rar
How to run example
There are 2 examples in File:VisualPoint Example.rar. After extracting rar file, you can see:
- bubble - bubble sort example
- AVL2 - AVL Tree example
Steps
Take bubble for example.
- 在解壓縮VisualPoint Example.rar後,開啟VisualPoint Example/bubble/bubble.sln
- 在Visual Studio中
- 將中斷點設在 line 16: int temp = s[y+1]; 上
- 直接F5執行專案
- 專案進入debug mode且程式會停在line 16中斷點上
- 點擊Tools -> VisualpointAddin開啟VisualPoint
- 在VisualPoint中
- 選擇Capture Mode
- 點選右上角visualize按鈕視覺化變數 (Ex.矩陣、變數)
- 在Visualize Form中,輸入"s"來視覺化s陣列
- 此時xDIVA的mapping dialog會跳出,在xDIVA的mapping dialog中
- 建立5個cube_uvbm來視覺化s陣列,如圖:
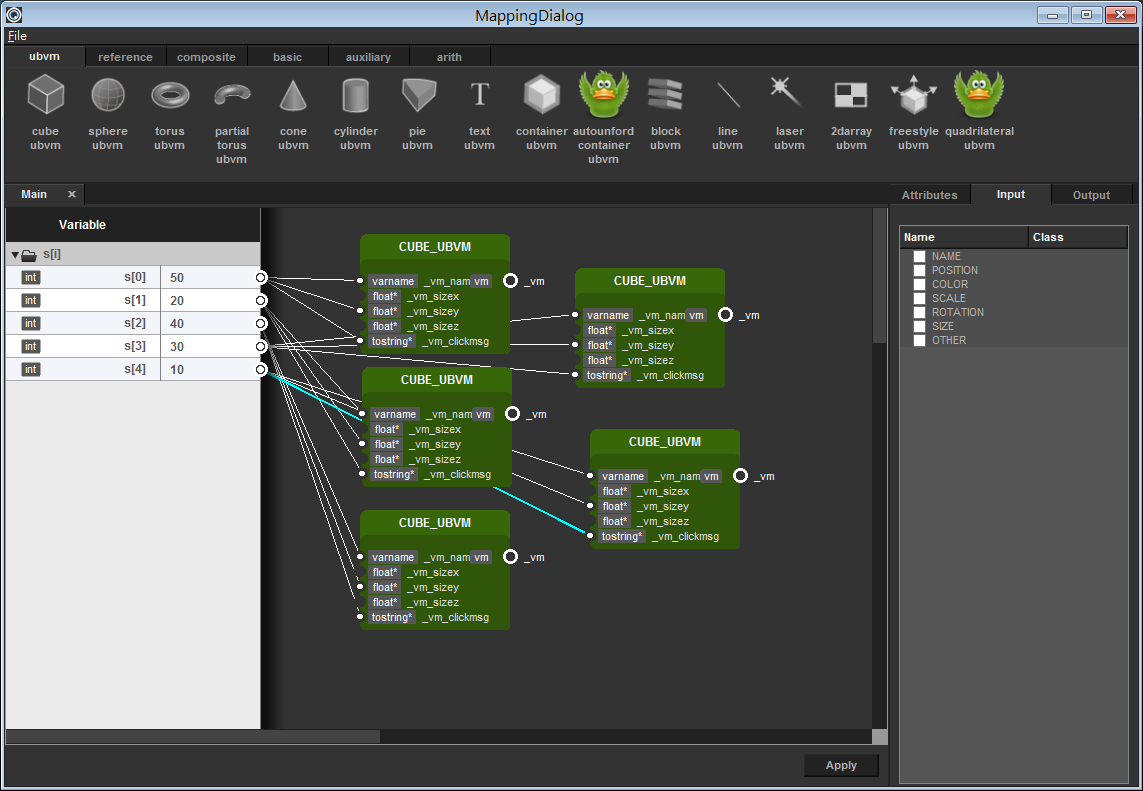
- 左上選單 -> 存檔MDS
- 按下右下角apply
- 建立5個cube_uvbm來視覺化s陣列,如圖:
- 切換至VisualPoint,選擇 Replay Mode
- 此時xDIVA的mapping dialog會跳出,在xDIVA的mapping dialog中
- load剛剛存好的MDS檔
- 切換至VisualPoint,選擇播放速度。(由左至右為:逐步播放、每隔6秒自動放播、每隔4秒自動放播、每隔2秒自動放播、暫停)
- 回到xDIVA觀看Visualize變化
